Your shopping cart is empty!
Welcome visitor you can login or create an account.

Shopping Cart
0 item(s) - $0.00
- Categories
- About Us
- Specials
- Payment Method
- Contact Us
- Blog

PZ Support Resistance

Product Code: PZ Support Resistance
Availability: 1
Availability: 1
Price:
$12.90
Support / Resistance
Metatrader (MT4/MT5) Indicator
"Emotionally charged events are remembered better and have a stronger impact in human behavior. The market causes joy or trauma to its participants and this is why support and resistance lines work."
Tired of plotting support and resistance lines? The PZ Support Resistance is a multi-timeframe indicator that auto-detects and plots important price levels while analyzing its importance.
- Boost your technical analysis overnight
- Detect important price levels without browsing through charts
- Recognize the relative strength of all price levels at a glance
- Save up to half an hour of plotting lines for every trade
- The indicator is non-repainting
Past and present price levels are collapsed by proximity and adjusted to the current market action. Lines are drawn where the action is and not necessarily at the peaks.
- Price levels get darker and wider as they get rejected over time
- Unimportant price levels are cleared regularly to avoid noise
- It implements email/sound/push alerts for breakouts
Enhance your trading activity with the best and most complete Support and Resistance auto-detection indicator, just like our customers have already done.
- Lifetime software updates and support
- Current version is 1.0 (Updated February 2014)
Buy from market
- Need help? Watch thetutorial. Too much trouble? Use the buy directly button below.
Get it for free!
- Fund an account with any of our recommended brokers and use this tool for free.
- 1) Open an account
- 2) Download it for free!
How to trade
A brief introduction
Resistance and support lines are price levels which temporarily halt or reverse the continuous movement of the trend. When the trend is bearish, support lines are created where sellers are temporarily (or sometimes permanently) exhausted and cannot press the quote any lower. Conversely, during a bullish trend, the price level where buyers are checked is called a resistance line.
How are support and resistance levels created?
When a dealer enters a buy order, the broker has the order filled by executing as many offers as possible until the amount the customer desires is reached. If the original order is a large market order, the broker will keep climbing on the price ladder until the order is fulfilled. Support and resistance points are created when the total orders in the market are not enough to clear the offers at a particular price level. When the orders are sell orders, and there are more than enough buyers at a particular price to exhaust the sellers, that price level is called a support; when there are more sellers than the buyers' orders can clear, the price level is a resistance.
Since many participants expect a price level to resist or support the quote, that price level will act in the anticipated manner regardless of what the other variables suggest. In a sense, technical analysts claim that traders behave like pack animals.
Why support and resistance levels work
Emotionally charged events are remembered better and have a stronger impact in human behavior. The market causes joy or trauma to its participants and this is why support and resistance lines work. But there are a few more reasons.
- Resistance and support are relatively easy to identify on charts. From the most seasoned analyst to the forex freshman, traders don't have a lot of trouble identifying and drawing support and resistance lines.
- Support and resistance lines often receive a lot of attention from news sources like Bloomberg or CNBC. The public is led to identify a particular price as a decisive or key level, and when it acts accordingly, the significance of these levels is easily established.
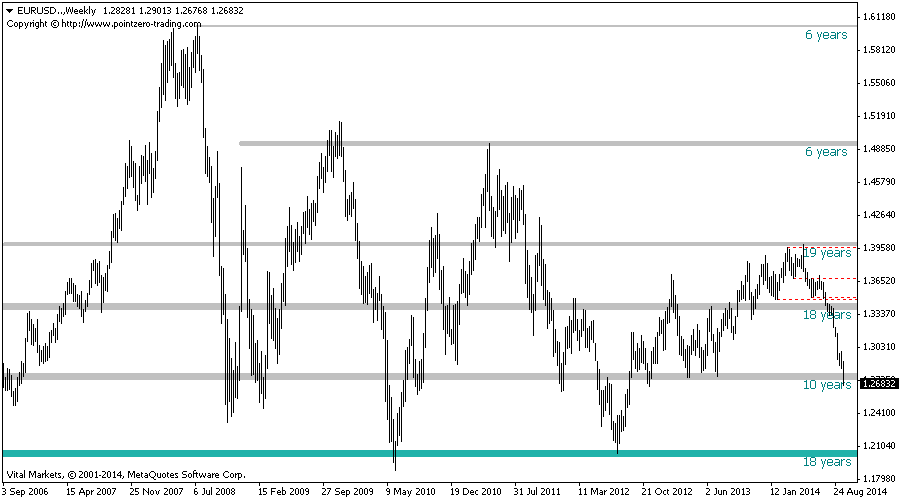
- Support/resistance lines are not just imaginary lines drawn at the whim of the analyst. Multi-year, multi-month, multi-week support and resistance are often defended by large order clusters, originating enormous transaction volumes.
Watch the video!
Take a look at the video in which I explain how does the indicator work, how to use it, what makes it especial and how different price levels are collapsed by proximity.
How to trade using price levels
The basic and most important usage of price levels it not to trade breakouts like most people think, but to recognize price ranges in which a trade can move favorably without being disrupted. Support and resistance levels are not fixed prices, but price ranges: this is why breakouts do not work very well by their own.
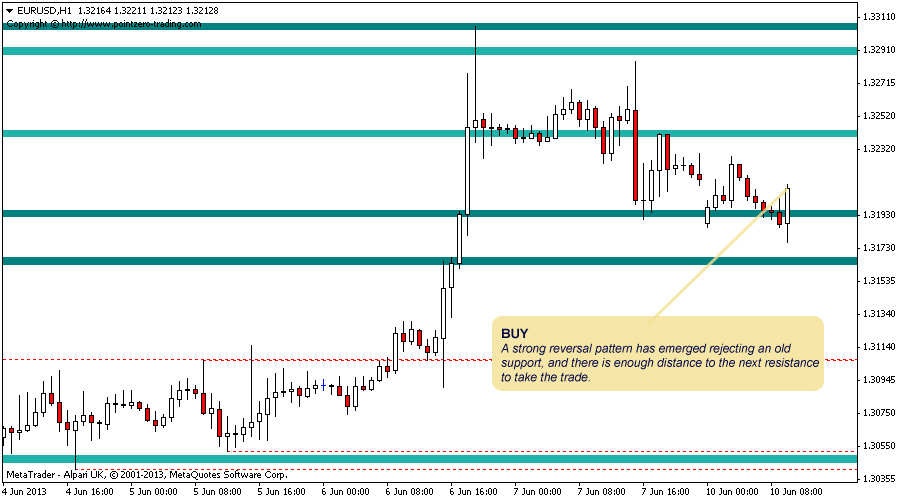
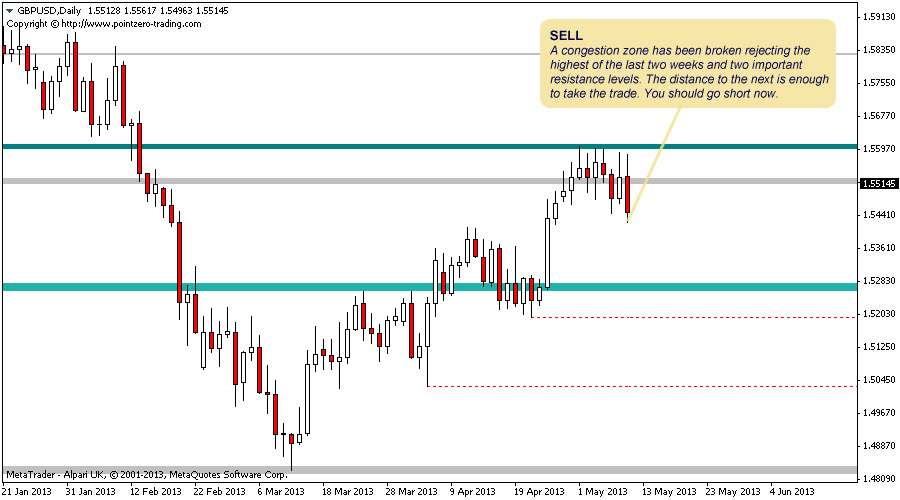
The best scenario to go long is the following:
- A support has been tested and rejected, meaning the price has closed above it. Hopefully, creating a reversal or continuation pattern of some sort.
- The distance to the next resistance is bigger than the distance to the rejected support. This simple fact increases the odds of the trade moving in your advantage without disruption and increases the expectancy of the trade.
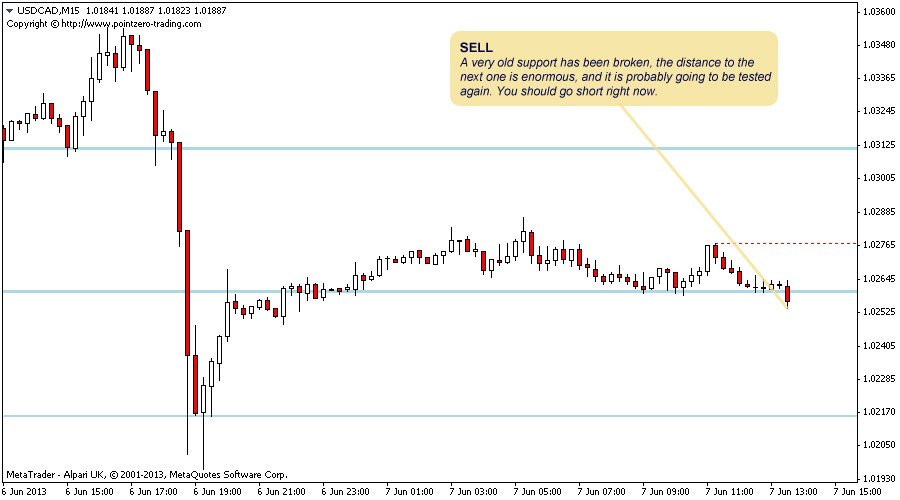
The exact opposite applies for shorts. Let's look at some examples.
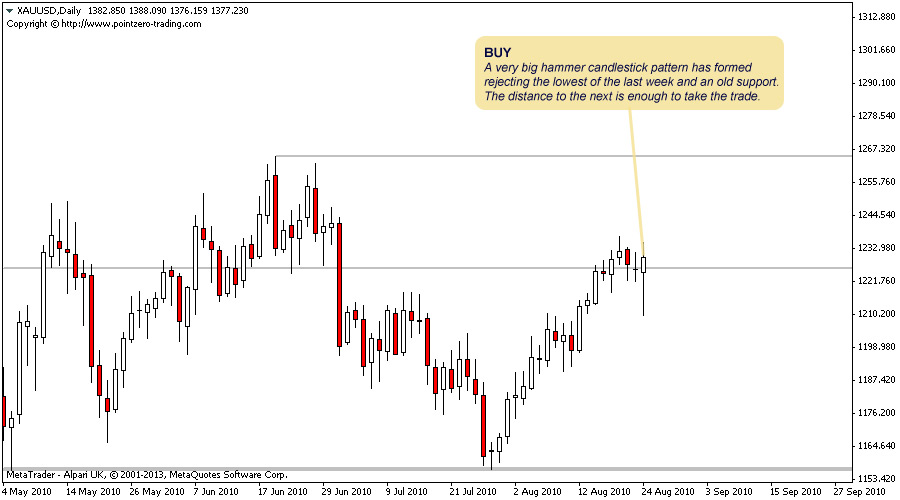
Some trading examples
The goal of using support and resistance lines is to find price ranges in which a trade can move favorably without being disrupted and increase the expectancy of your trades. The perfect setup is a strong rejection of a price level far away from the next one. Below are a few examples.
Settings
The indicator parameters
When loading the indicator to any chart, you will be presented with a set of options as input parameters. Don't despair if you think they are too many, because parameters are grouped into self-explanatory blocks. This is what each parameter does.
The line settings include line widths and colors. You can choose which is the minimum and maximum width for every line plotted on the chart, as well as the different colors used to highlight the relative importance of support and resistance lines.
- Periods
- The indicator is constantly looking for rejected tops and bottoms. The period is the minimal amount of bars where there will not be two tops or two bottoms. For an ideal performance, lower timeframes should have bigger periods.
- SmoothFactor
- Different support and resistance lines are collapsed by proximity and moved to the price level which displayes most activity and connects more past tops and bottoms. Increase the SmootFactor to collapse more price levels into one, or decrease it to display more levels with more price accuracy.
- Line Settings
- Alerts
- Enable display/email/push/sound alerts for breakouts.


![[DOWNLOAD] PZ Supply/Demand](https://forex-discount-shop.com/image/cache/data/pz supply demand-156x156.png)